THE ANALYSIS IN PRACTICE
Your analysis.
In focus.
From the weekly narrative to the entry. Explore the original charts and the reasoning behind them.
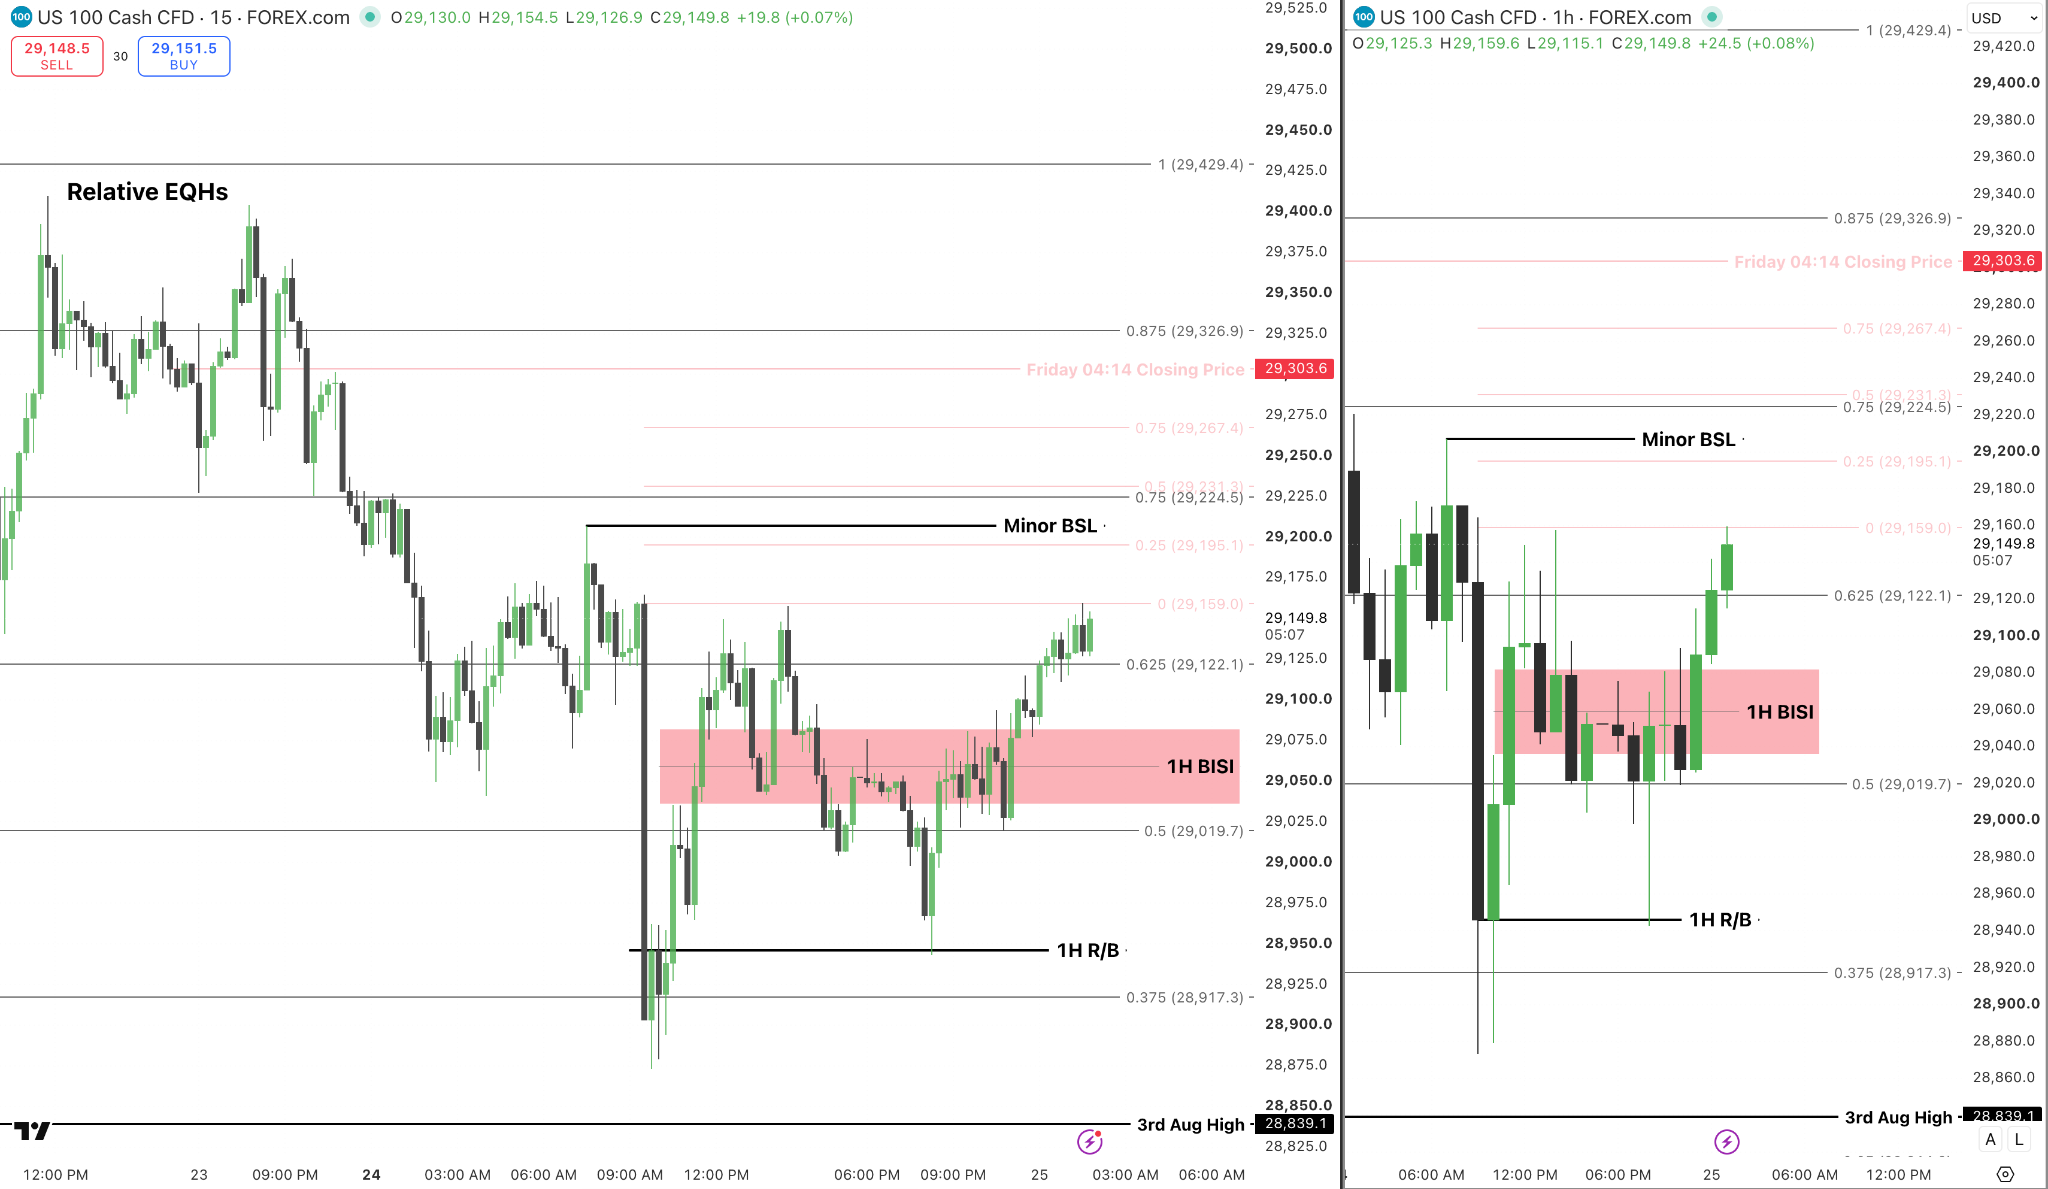
Relative equal highs, minor buy-side liquidity, the hourly BISI, and rejection block.
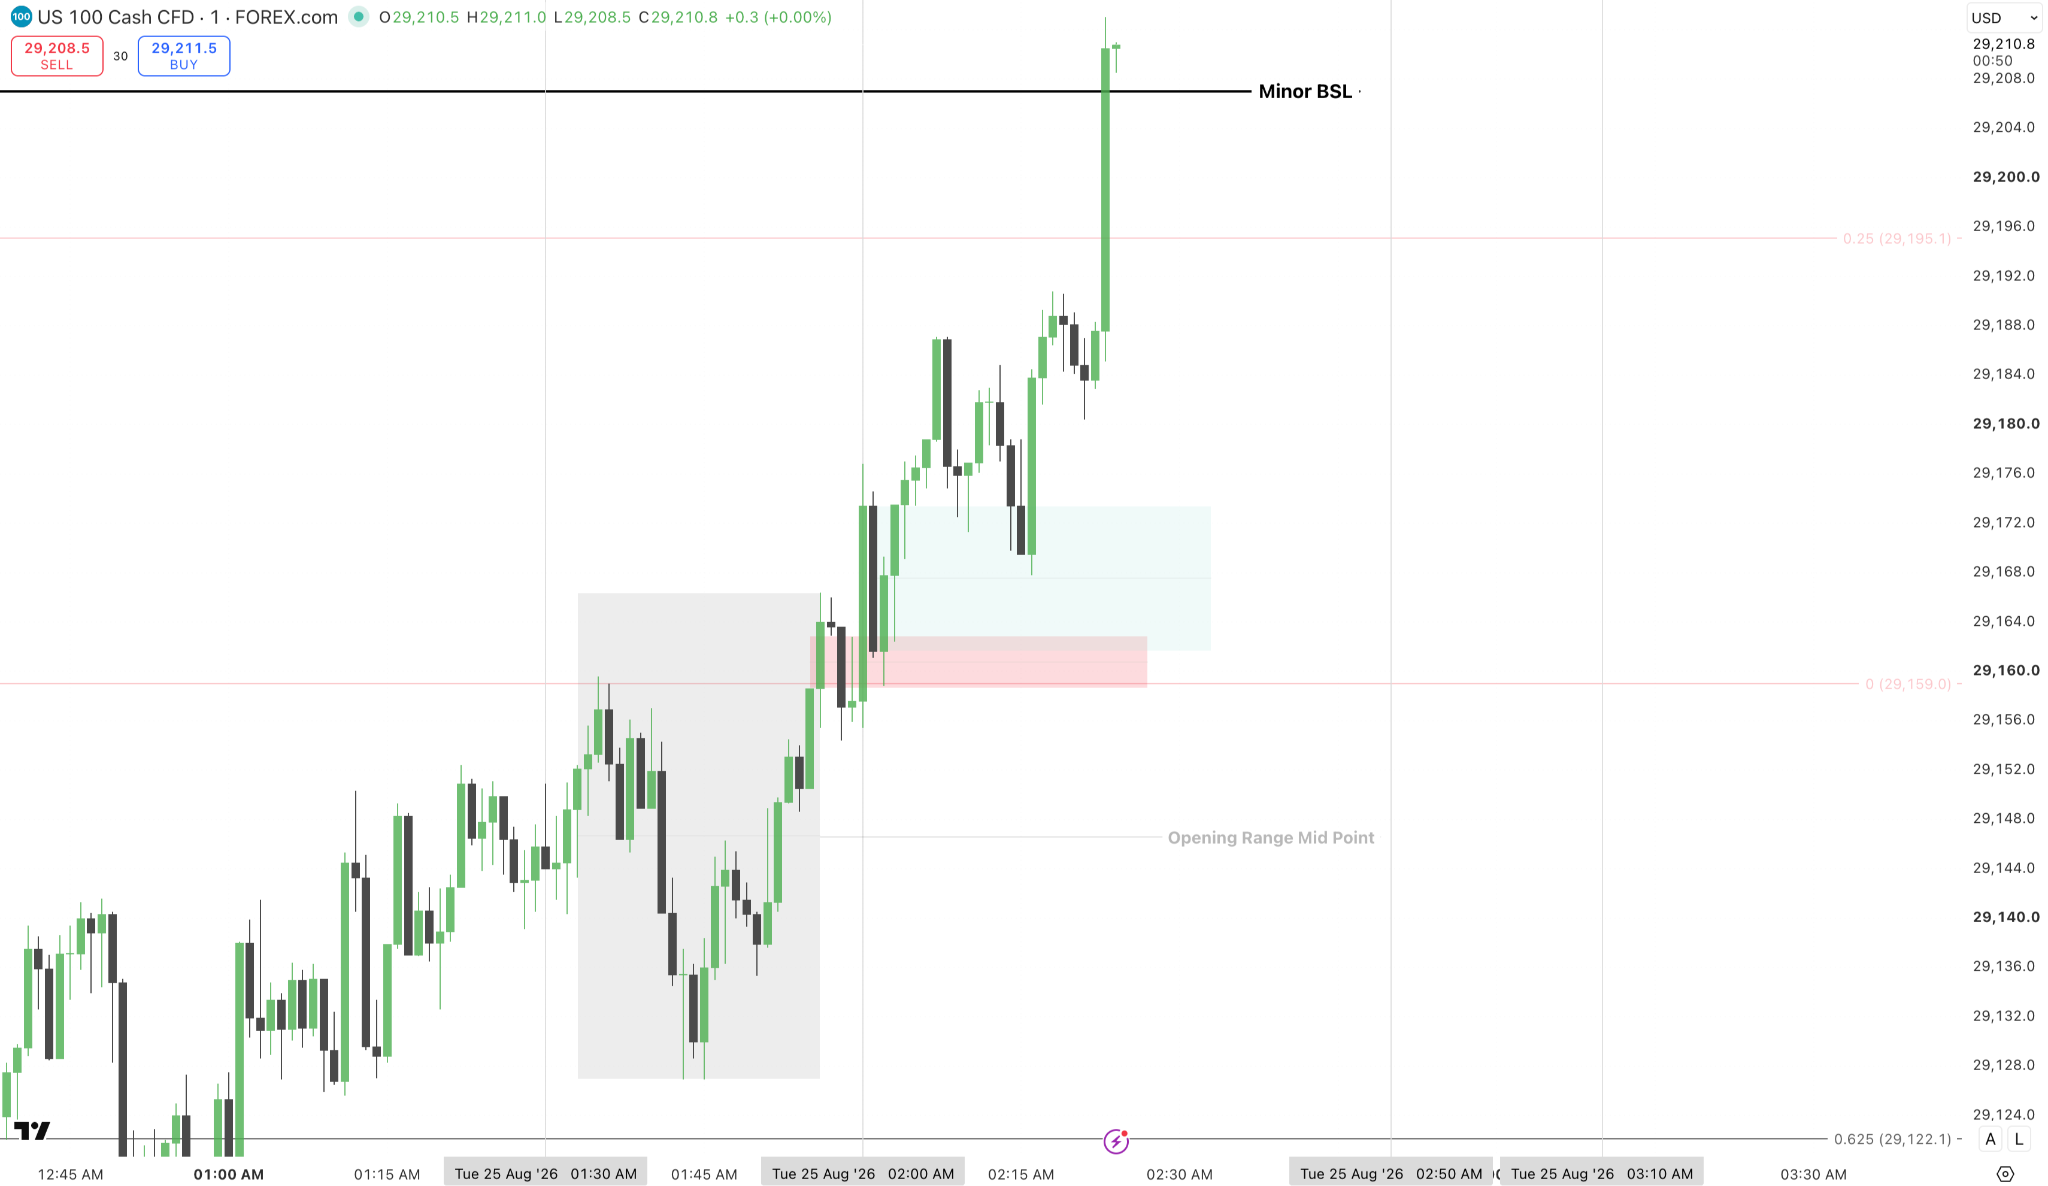
The lower-timeframe chart shows price reaching the marked minor buy-side liquidity after the outlined analysis.
Read the full narrative
$NQ · TUESDAY, 25 AUGUST 2026 · HTF ANALYSIS
Your analysis. In focus.
Key reference levels
- Relative equal highs: 29,410
- 1H rejection block: 28,946
- Minor buy-side liquidity: 29,207
- Hourly BISI: 11:00 AM, 24 August
Monday’s price action established a higher-timeframe bullish bias for the week by trading into the 0.50 level of the weekly BISI and forming a Smart Money Reversal.
Price then respected the marked hourly rejection block and began trading higher.
The outlined scenario
Initially, I was looking for price to draw toward minor buy-side liquidity. A raid on sell-side liquidity on the lower timeframe could then support a potential rally toward the relative equal highs.
Historical analysis · The supplied screenshots use a US 100 CFD chart.
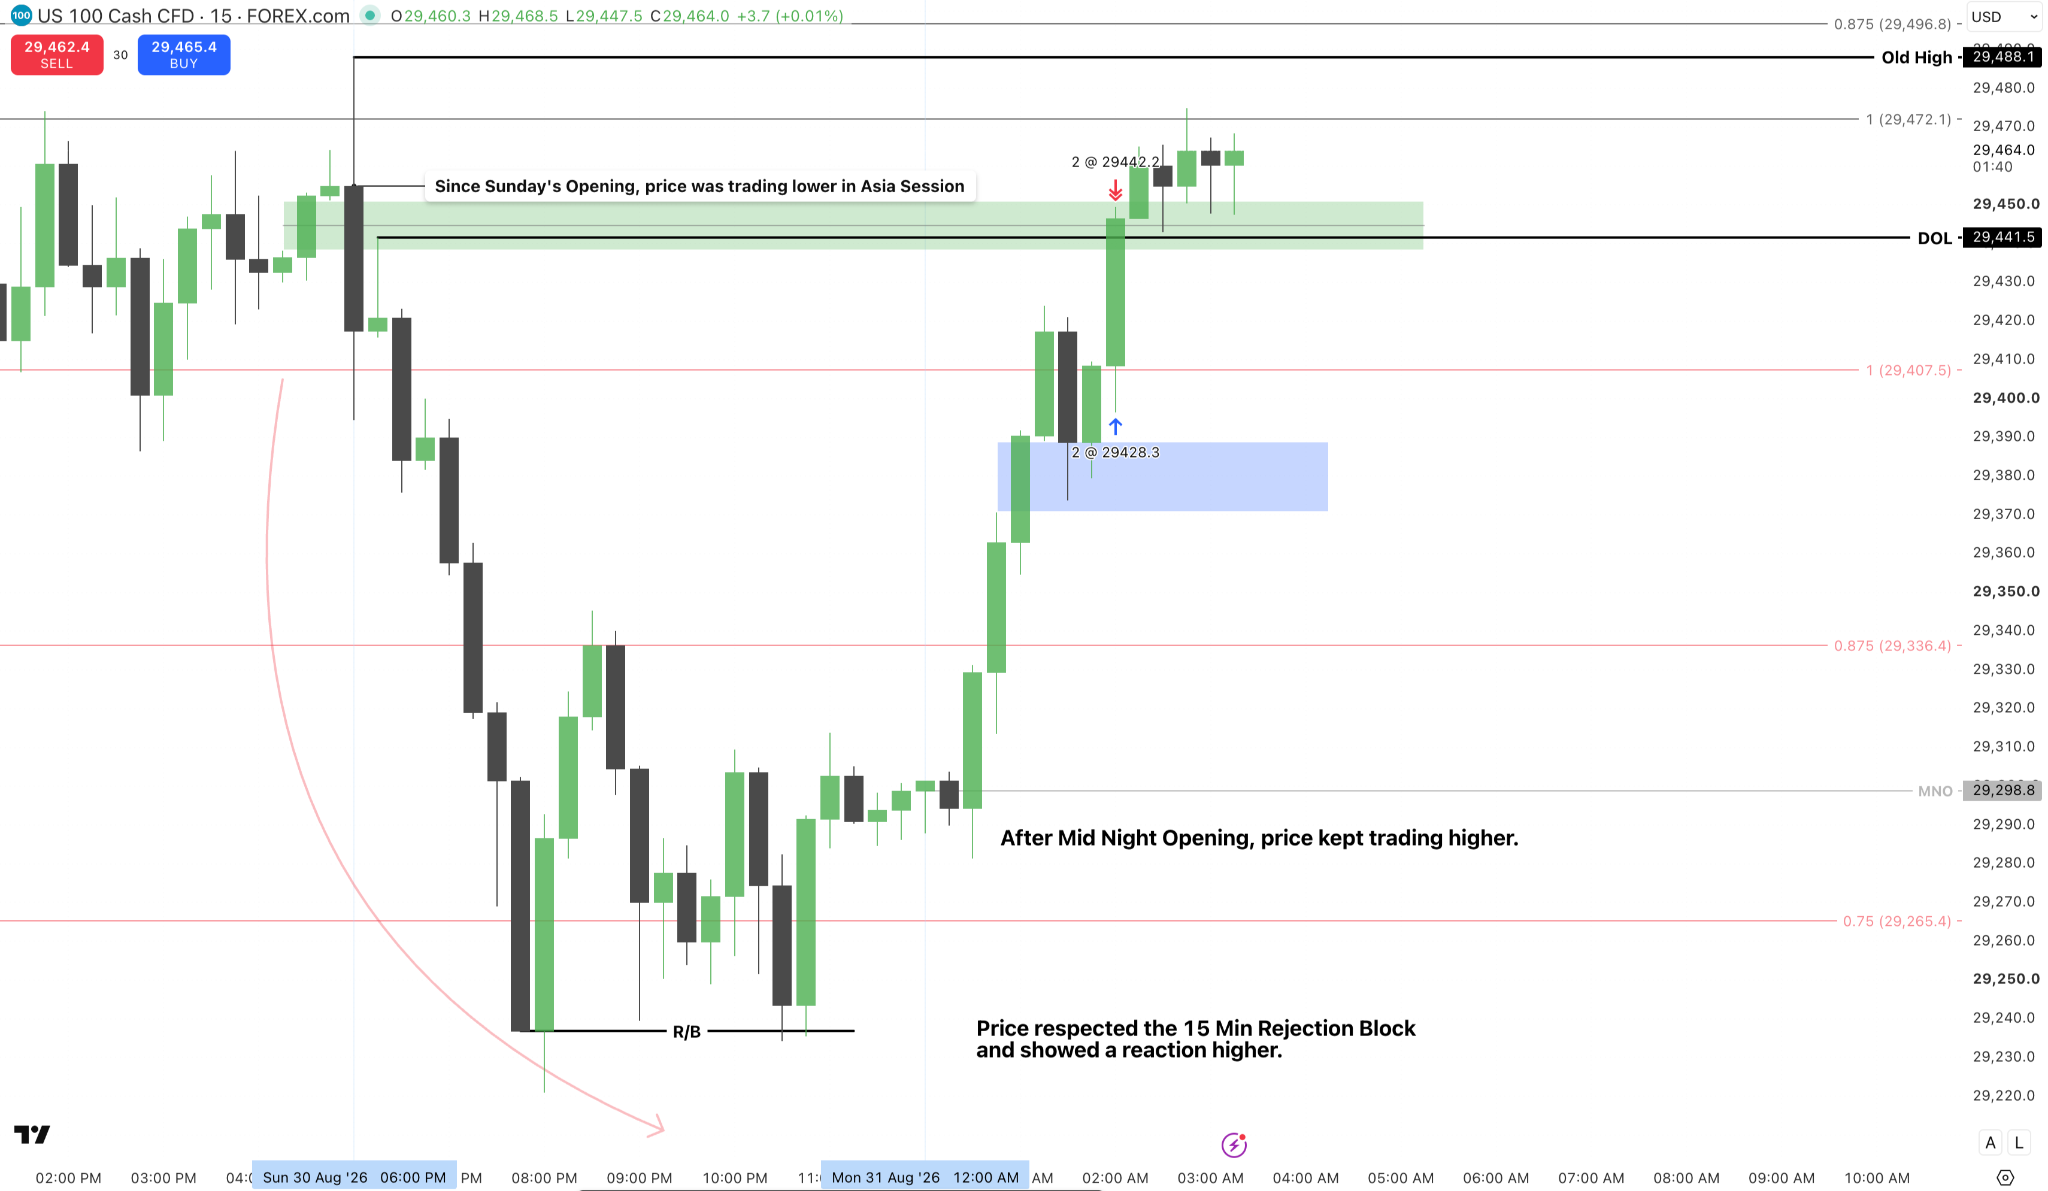
Following the Sunday opening decline, price respected the 15-minute rejection block and moved higher after midnight. The marked draw on liquidity provided the objective.
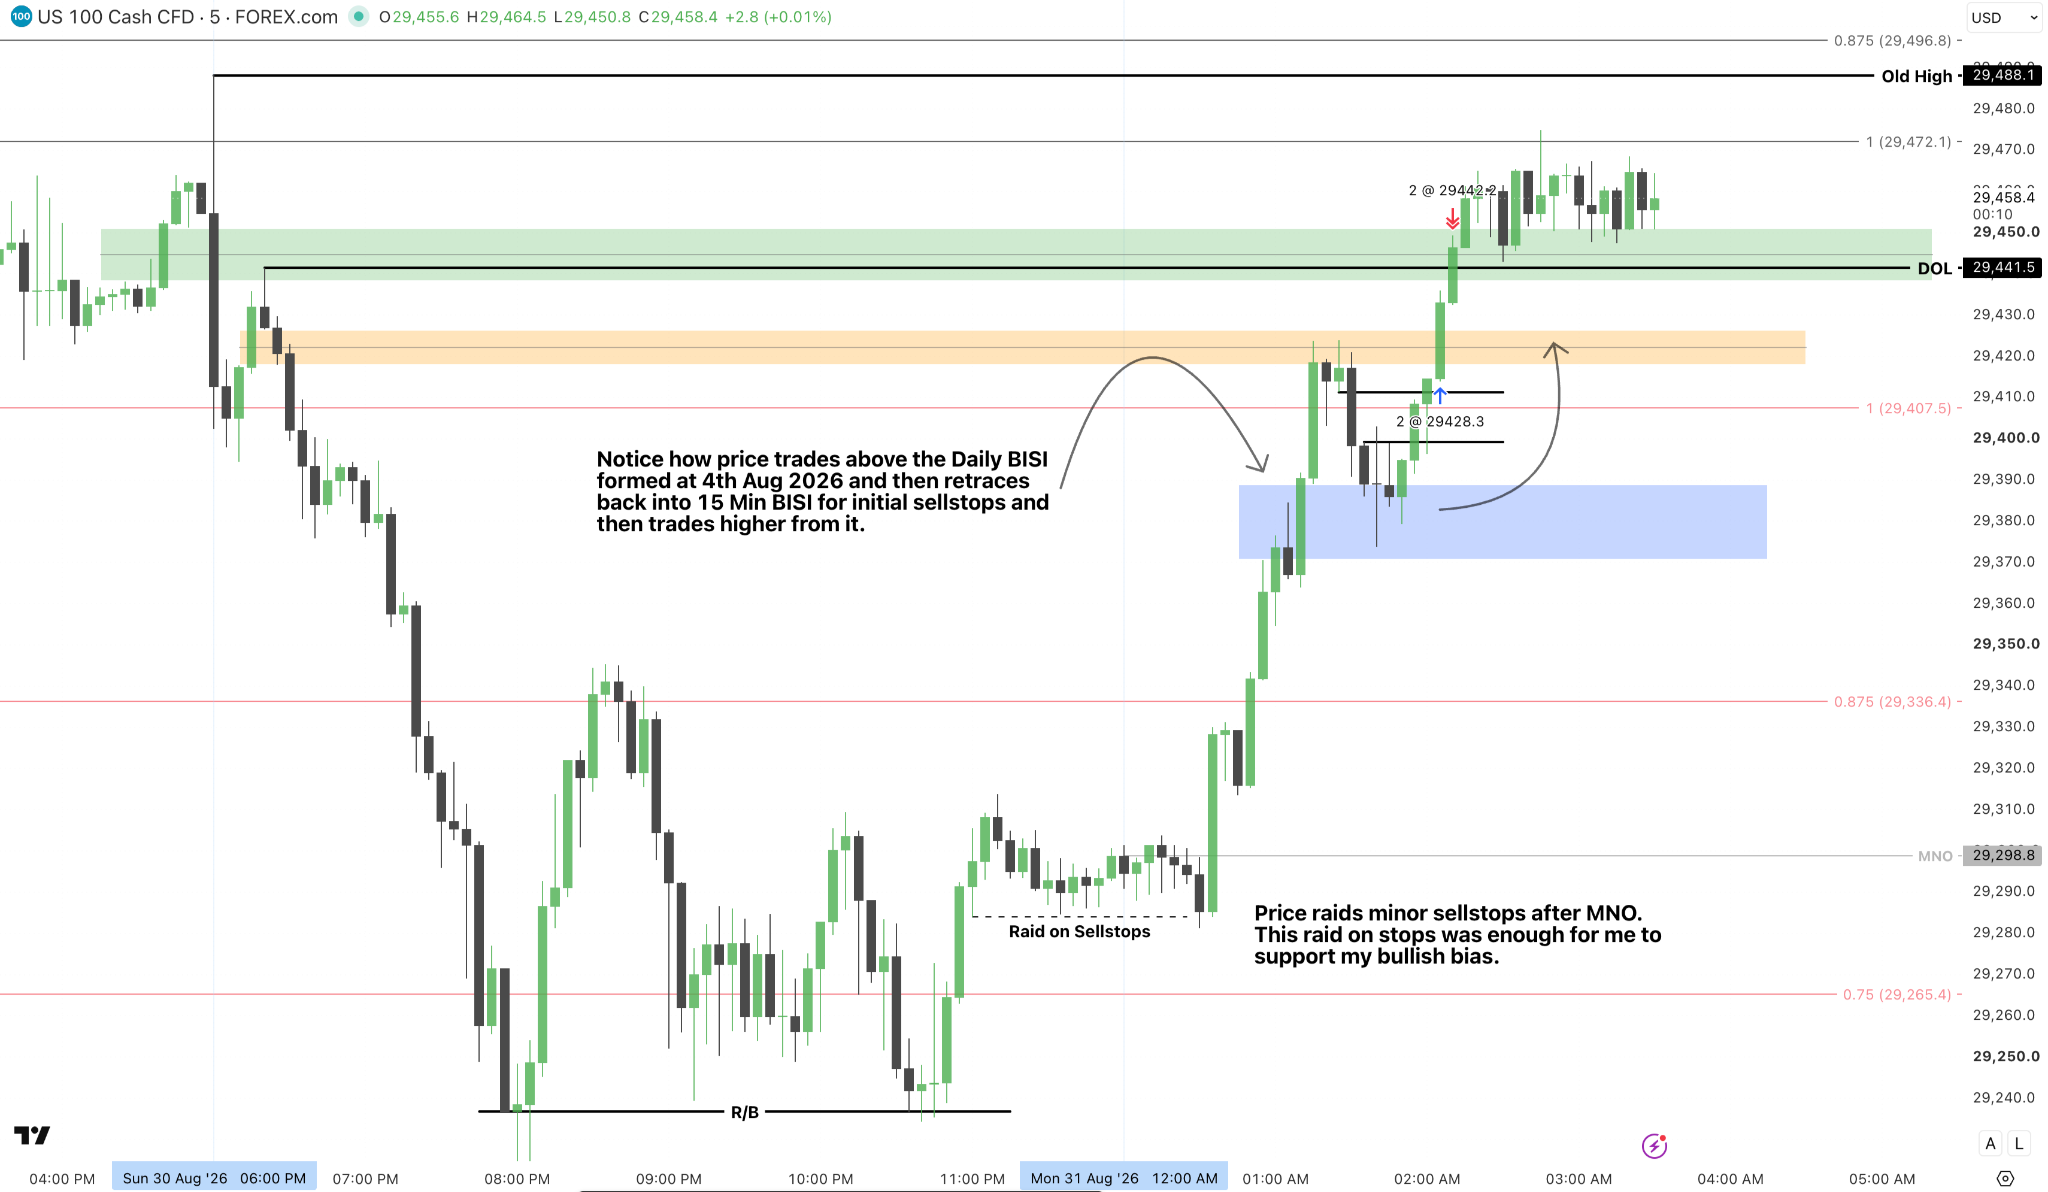
After midnight, price raided minor sell-stops. The subsequent move above the daily BISI and retracement into the 15-minute BISI supported the bullish narrative in this example.
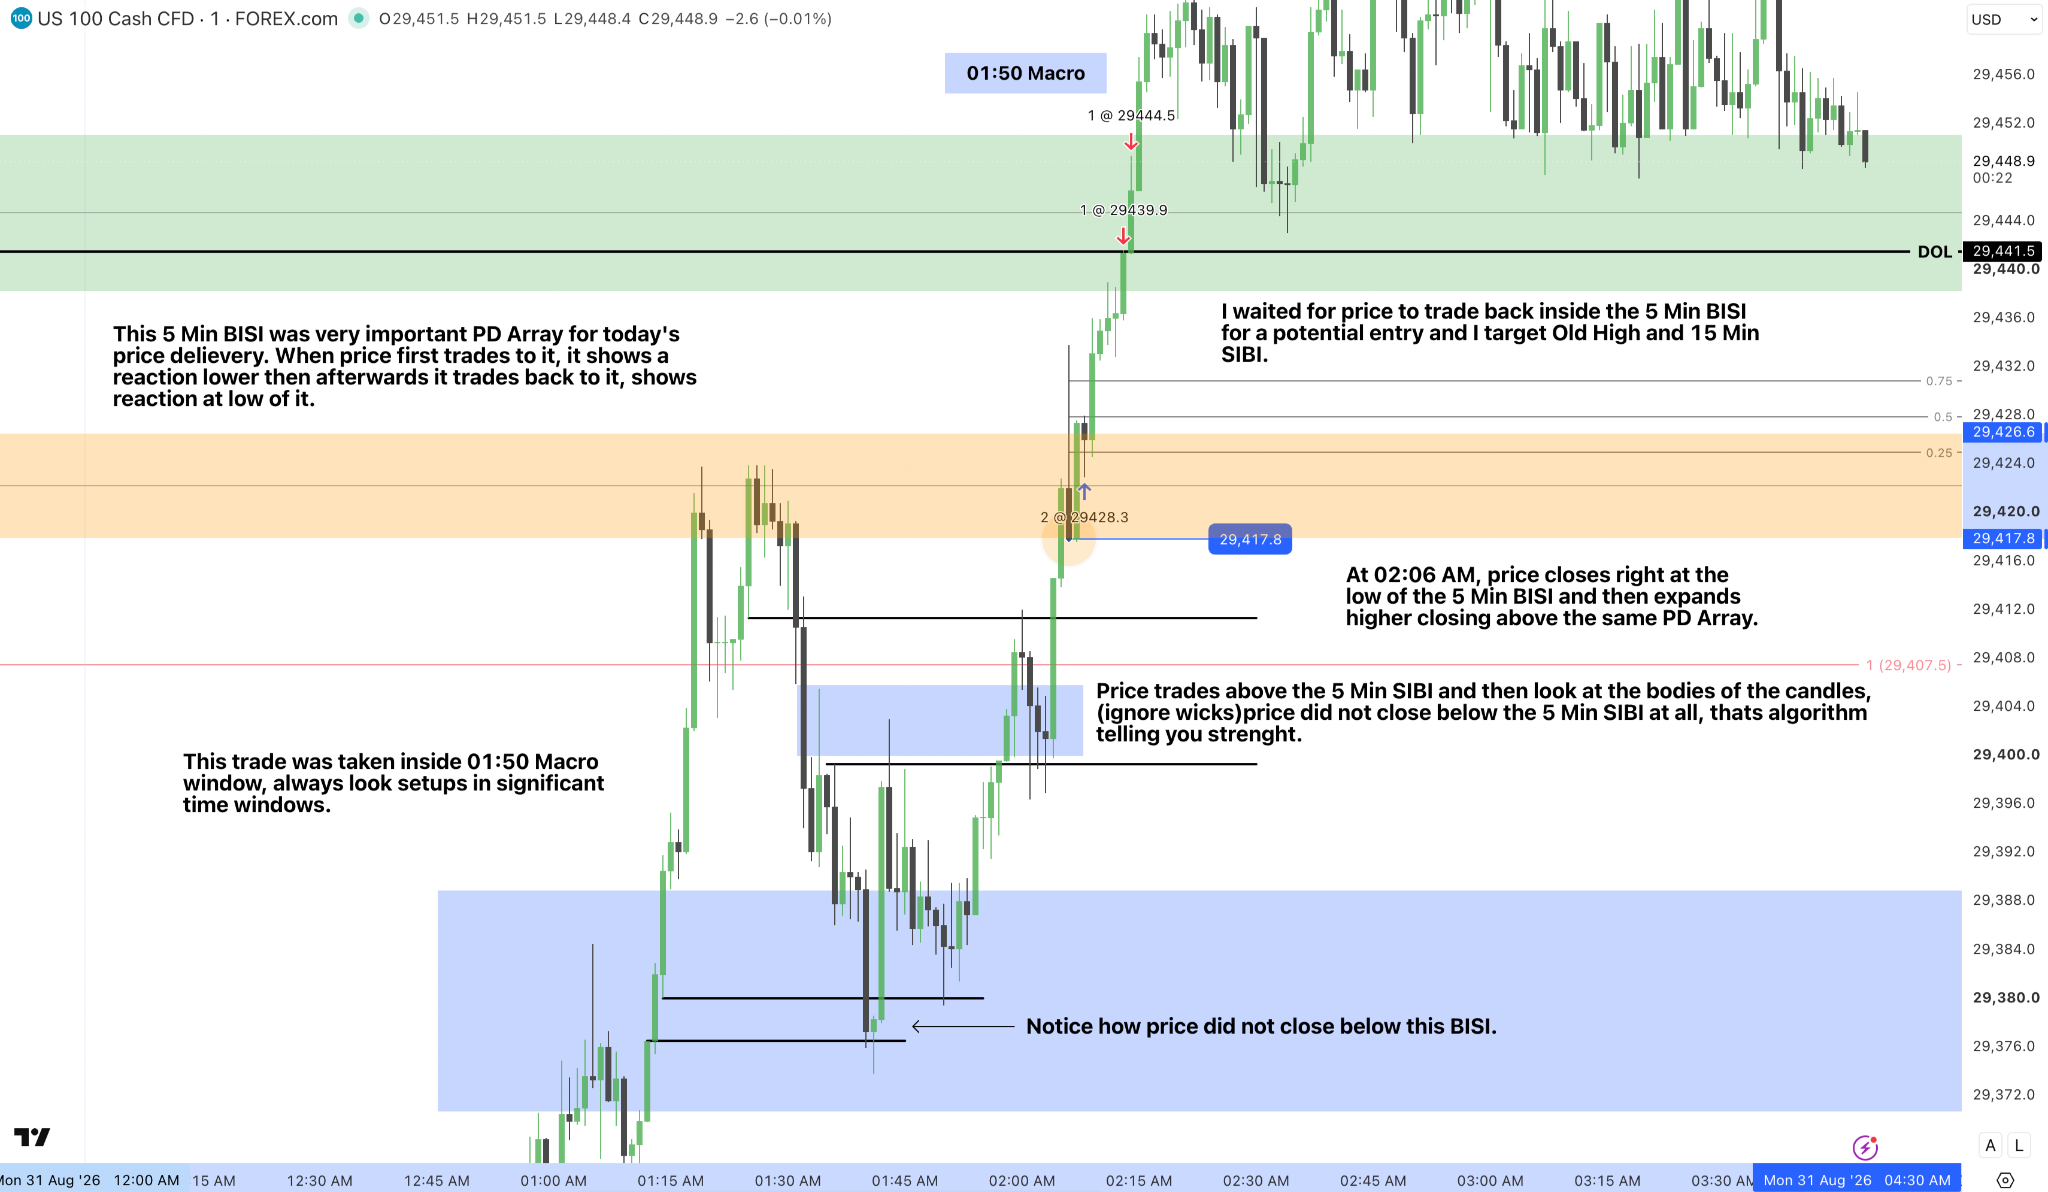
The breakdown follows the 01:50 macro window. Candle bodies held above the marked array, and a return to the 5-minute BISI provided the entry context. The old high and 15-minute SIBI were the outlined objectives.
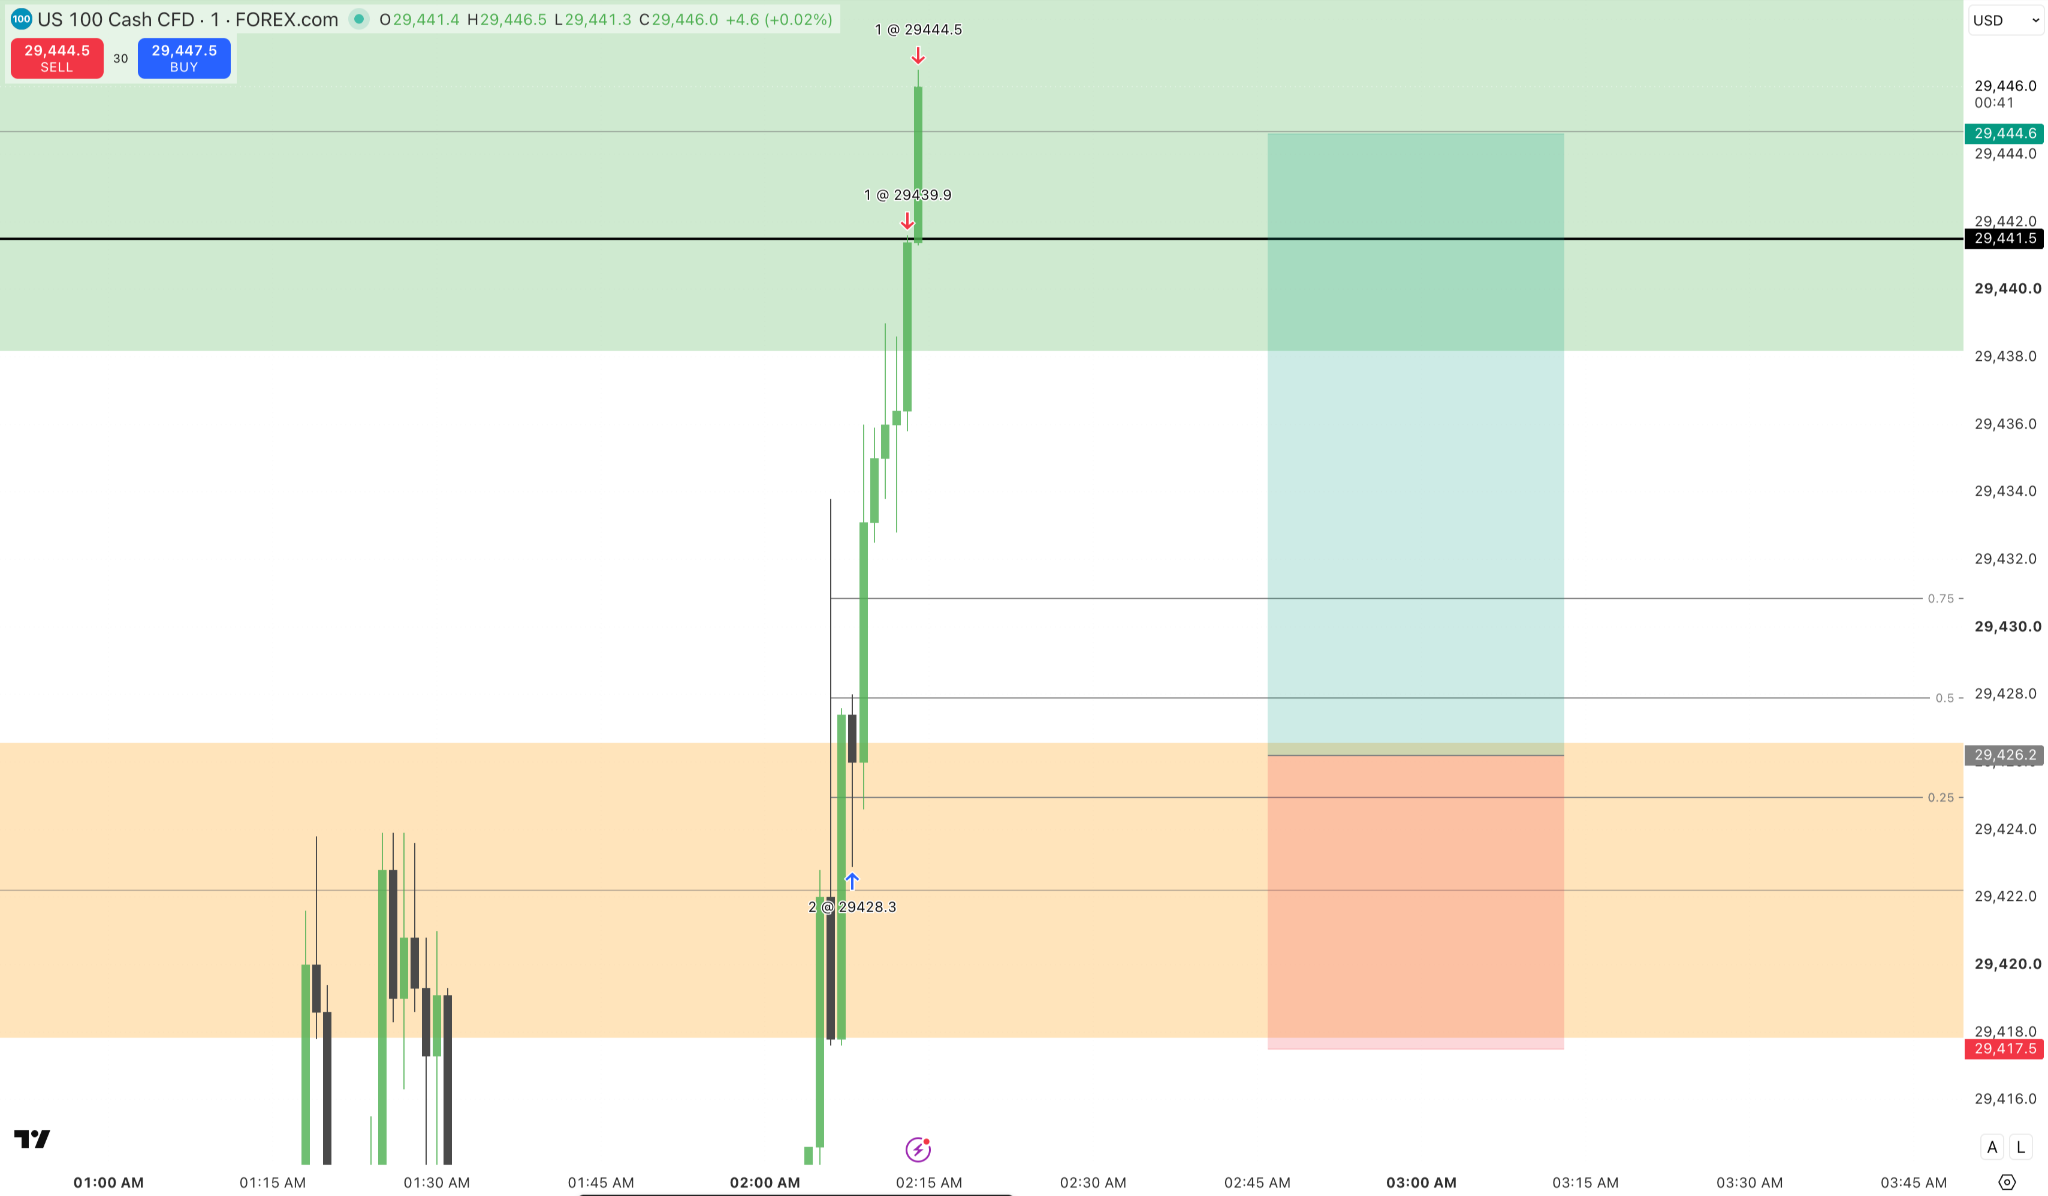
The one-minute chart shows the entry at 29,428.3 and partial exits at 29,439.9 and 29,444.5. The marked BISI and liquidity objective connect this execution to the annotated breakdown below.
Read the full narrative
Follow the higher-timeframe context, liquidity raid, entry confirmation, and execution through the four annotated charts. Each image retains the original reference levels.
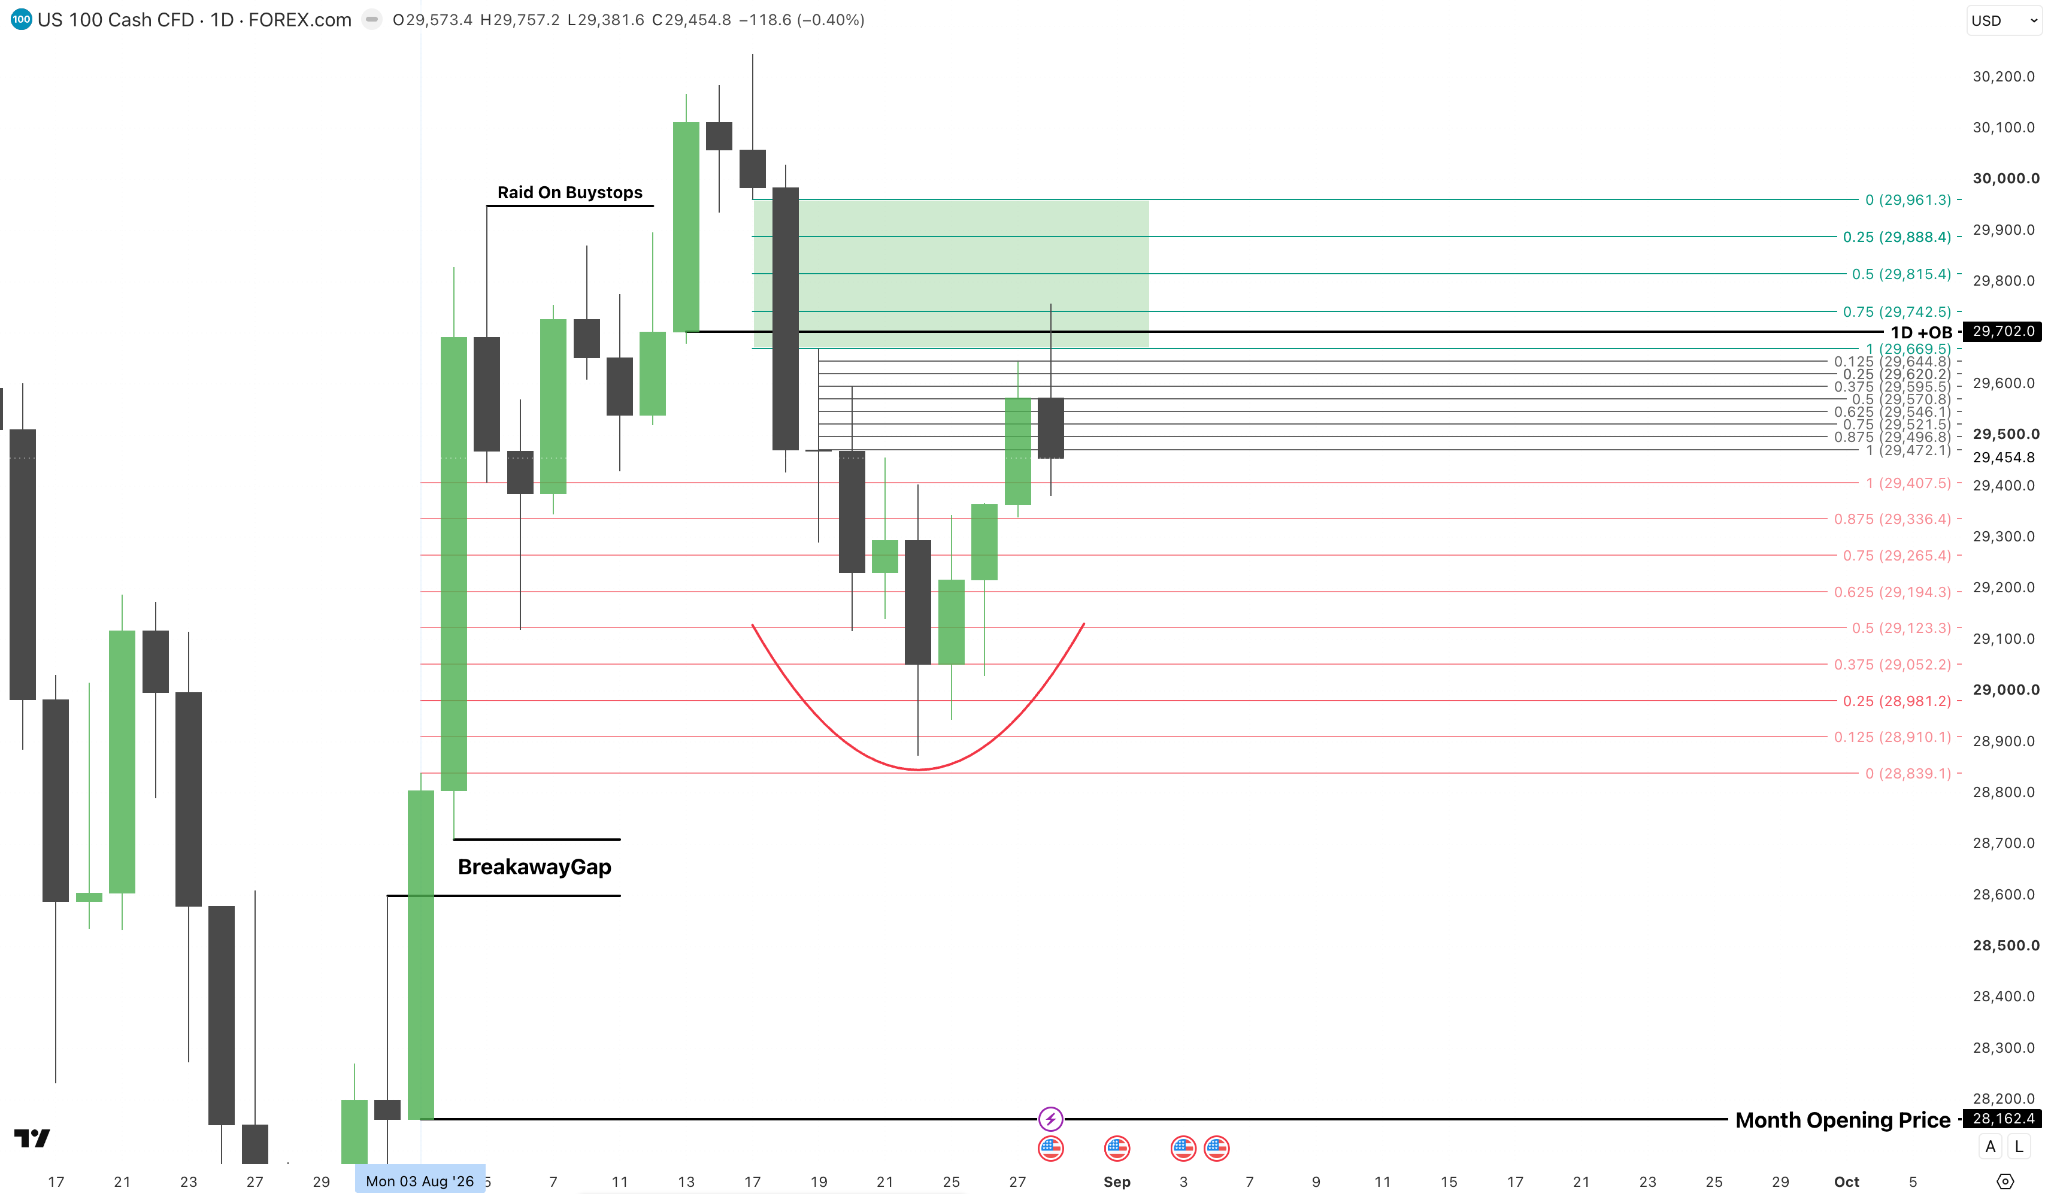
The broader daily chart connects the breakaway gap, raid on buy-stops, and retracement into the daily BISI.
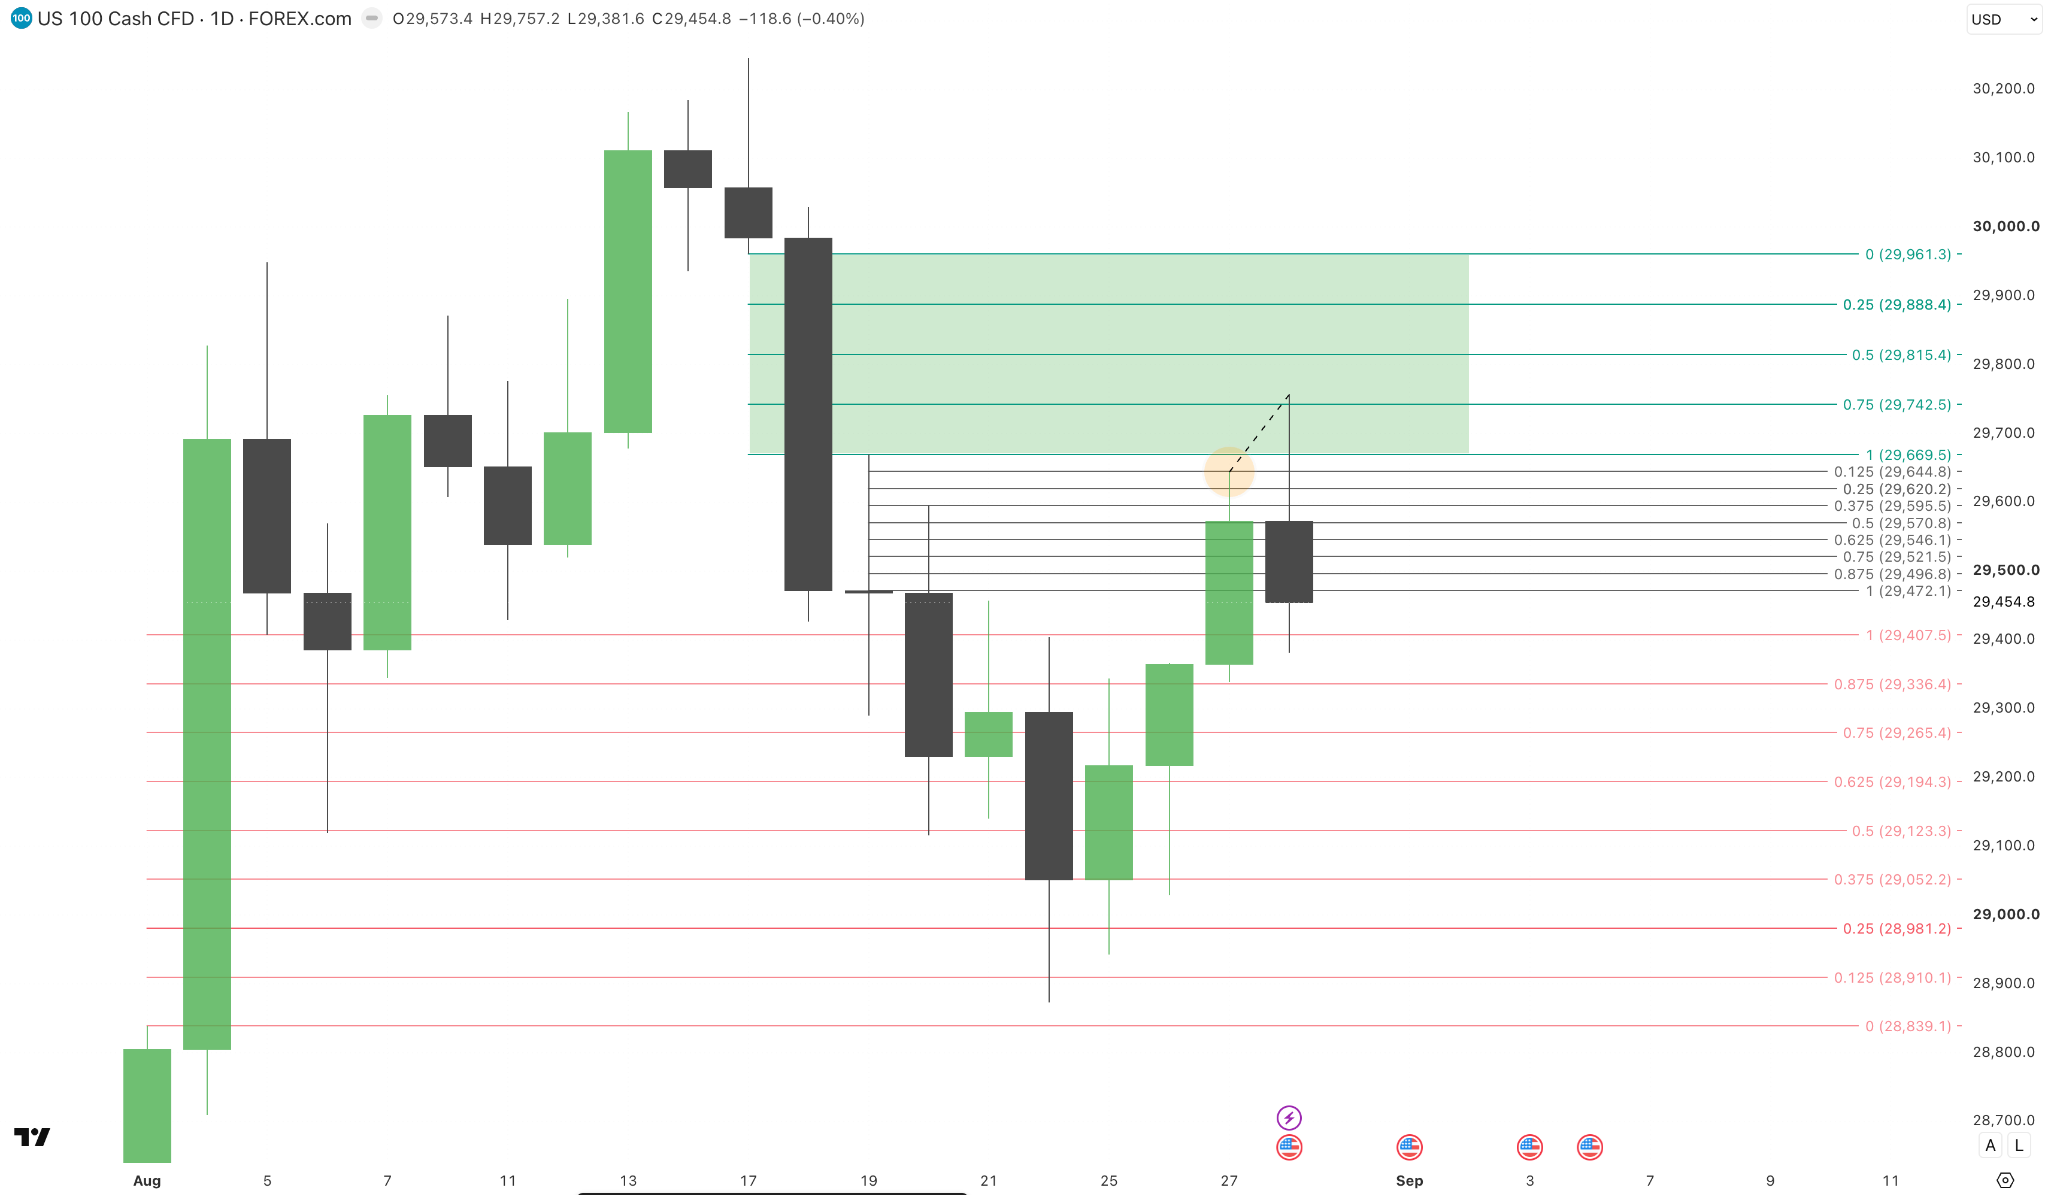
These reference levels organize the higher-timeframe analysis and the areas to watch as the following week develops.
Read the full narrative
ARCHIVED ANALYSIS · 30 AUGUST 2026
Important reference levels
- Daily SIBI formed on 18 August 2026
- Daily BISI formed on 4 August 2026
- Daily premium wick formed on 19 August 2026
- Daily order block formed on 13 August 2026
Higher-timeframe outlook
At the start of August, price advanced aggressively and formed a daily breakaway gap, which I read as a sign of directional strength. The buy-side liquidity formed on 5 August was swept on 13 August before price moved lower.
Price then retraced into the daily BISI formed on 4 August. After taking minor sell-side liquidity, it began moving higher again.
Expectations at the time
My outlook favored higher prices into September, while allowing for lower prices during the first half of the following week. I was also considering a possible retracement in November and December. Seasonal tendencies were part of that expectation, alongside the marked price levels; they were not a guarantee of direction.
Historical analysis shared as a membership example, not a current trade signal.
Historical examples, not current trade signals. The supplied charts use US 100 CFDs; membership focuses on NQ.